

January/February  2020
2020
HIT Happenings: Harm Index Improves Patient Safety
By Rosemary Baczewski, RN, MA, LSSMBB
For The Record
Vol. 32 No. 1 P. 30
Most adult Americans are familiar with the health care dictum “First, do no harm.”
Yet as we all know, harm in some form occurs all the time in even the best hospitals and with the best clinicians. It’s always been assumed to be an unavoidable byproduct of care, enabling administrators and clinicians to think in terms of “acceptable levels.”
But if you put a face on that harm—your spouse, your child, your neighbor—reducing it to nil takes on greater urgency.
That was the starting point for Greater Hudson Valley Health System’s (GHVHS) implementation of a Harm Index. With three main facilities and dozens of provider offices serving the residents of southeastern New York State, we are not just faceless providers; our patients are often people we know personally.
GHVHS believed developing a Harm Index—a concept sponsored by the American Hospital Association (Center for Healthcare Governance), Health Research & Educational Trust, Trustee magazine, and the Partnership for Patient Safety—and the processes around it would enable it to document and evaluate every patient harm and near-miss. GHVHS could then use Big Data analytics to track trends to determine whether the efforts to improve the quality of care and patient safety were making a difference. The health system committed to building it in 2014 and launching it January 1, 2015.
Building Blocks
The first step was to define exactly what is meant by harm. In that vein, a hierarchy was created that implemented standards based on or reported from the Agency for Healthcare Research and Quality, the National Quality Forum, and the Centers for Disease Control and Prevention at the top level, then the Centers for Medicare & Medicaid Services, and finally New York State.
Next came populating the Harm Index. GHVHS’ internal occurrence reporting program (both declared and anonymous reports), infection control surveillance program, and data fed from the EMR system to Axiom clinical analytics software from Kaufman Hall were used as sources. The analytics are used in real time to answer queries about performance in key areas such as hospital-acquired pressure ulcers (Stage III, IV, and unstageable), injuries from falls (eg, fractures, concussions), obstetrical adverse events (eg, serious injuries to mothers and/or neonates during delivery), postoperative venous thromboembolisms, surgical complications, and unexpected deaths.
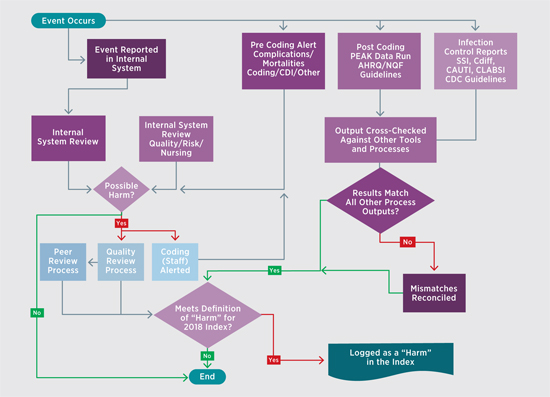
Once gathered, the data can follow one of two workstreams (see figure) depending on the nature of the incident. The two workstreams ultimately converge, and events are evaluated weekly by a team of experts to determine whether there was an actual harm based on the previously mentioned standards. If so, the event is added to the Harm Index. If not, it goes back for peer or quality review, where it may lead to disciplinary action or other remediation.
As the process was being developed, internal systems were revised to transition coding from being a finance function to a quality function. Prior to the Harm Index, coders were instructed to put as few codes as possible on the bill to get it out the door as quickly as possible. By putting coding under quality, GHVHS was able to focus on ensuring it accurately represented the condition of the patient while he or she was in the facility.
GHVHS also worked with its physicians to help them think of care in terms of “care is rendered, care is documented, care is coded, and then care is billed.” This change in thinking helped them get on board with clinical documentation improvement efforts by demonstrating how better documentation leads to better outcomes with a reduction in patient harm. Additionally, clinicians and nonclinical staff were taught to embrace Big Data and the critical information it can provide.
Huge Gains in Harm Reduction
Using the clinical analytics platform with 2014 as the baseline year, the results were nothing short of remarkable. In the first year of the Harm Index (2015), there was a 35% decrease in total harms. From 2014 to 2018, the total reduction was 50%.
Since the goal is zero harms, however, it was decided to dig deeper to examine how the trends appeared per 1,000 discharges. As it turns out, the numbers were similar, with a 34% decrease from 2014 to 2015 and a 53% decrease through 2018.
Finally, GHVHS mined the analytics to measure risk-adjusted mortalities using the 3M All Patient Refined Severity of Illness and Risk of Mortality measure, the organization’s proxy for externally calculated risk-adjusted mortality. Additionally, any mortality that comes across as less than a 7 is reviewed in depth for optimization of clinical documentation and clinical care gaps.
The data were once again impressive: a 52% decrease from 2014 to 2015, and a staggering 80% decrease from 2014 to 2018.
Ongoing Program
GHVHS still has a long way to go to get close to zero, and the closer it gets, the more difficult it will be. But through a continuous commitment to education and clinical documentation improvement, and the use of Big Data analytics to identify and understand trends, GHVHS strongly believes the Harm Index can help it achieve the “First, do no harm” standard with every patient at every care site.
— Rosemary Baczewski, RN, MA, LSSMBB, chief clinical officer at Greater Hudson Valley Health System (now known as Garnet Health), is responsible for quality management, performance improvement, patient advocacy, and ensuring compliance with The Joint Commission standards, and Institute for Healthcare Improvement and National Quality Forum initiatives.

1721 Valley Forge Road #486
Valley Forge, PA 19481